Bullish Harami Pattern: A Complete Expert Guide for Traders and Investors
The Bullish Harami is one of the most reliable and widely followed candlestick patterns in technical analysis. For traders who want to identify potential trend reversals early—before the market fully changes direction—this pattern can be extremely valuable.
Unlike flashy indicators or complicated strategies, the Bullish Harami is simple, visual, and rooted in market psychology. Yet, many traders misunderstand it, misuse it, or expect instant results without confirmation. This guide is designed to change that.
In this in-depth, human-written article, you’ll learn exactly what a Bullish Harami is, how it works, why it forms, how to trade it correctly, common mistakes to avoid, and how professional traders use it in real market conditions.
What Is a Bullish Harami?
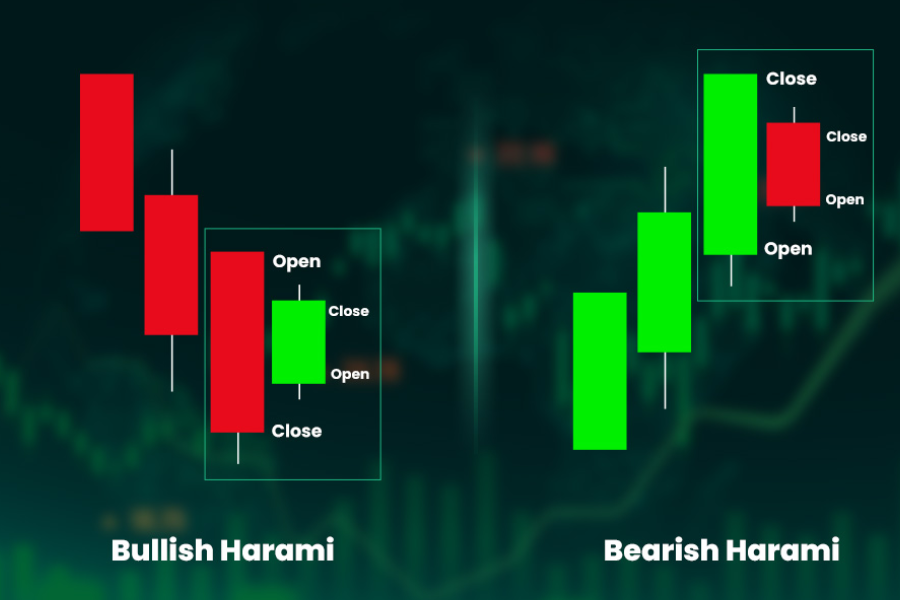
A Bullish Harami is a two-candlestick reversal pattern that appears at the end of a downtrend. The word Harami comes from a Japanese term meaning “pregnant”, which perfectly describes the visual structure of the pattern.
Structure of a Bullish Harami
- First candle: A long bearish (red) candle that continues the existing downtrend
- Second candle: A small bullish (green) candle that is completely contained within the body of the first candle
This structure signals that selling pressure is weakening and buyers are starting to step in.
Why the Bullish Harami Matters
Markets move based on psychology—fear, greed, uncertainty, and confidence. The Bullish Harami reflects a shift in sentiment:
- Sellers were in control
- Momentum begins to slow
- Buyers cautiously enter the market
- The downtrend starts losing strength
While it doesn’t guarantee a reversal, it alerts traders that conditions are changing.
Bullish Harami vs Other Bullish Candlestick Patterns
Understanding how the Bullish Harami compares to similar patterns helps avoid confusion.
Bullish Harami vs Bullish Engulfing
- Bullish Engulfing: Second candle fully engulfs the first (stronger reversal)
- Bullish Harami: Second candle is smaller and inside the first (more cautious reversal)
Bullish Harami vs Morning Star
- Morning Star: Three-candle pattern
- Bullish Harami: Two-candle pattern, simpler but requires confirmation
The Bullish Harami is generally considered a moderate-strength reversal signal, not an aggressive one.
The Psychology Behind the Bullish Harami
Understanding the psychology makes the pattern far more powerful.
Sellers Dominate
The first bearish candle shows strong selling pressure. Bears believe the downtrend will continue, and many traders panic or give up their positions.
Indecision Appears
The second candle opens within the previous candle’s body and closes higher. This shows:
- Sellers failed to push prices lower
- Buyers are gaining confidence
- Momentum is slowing
This loss of bearish control is the key insight behind the pattern.
Where the Bullish Harami Works Best
The Bullish Harami does not work equally well in all conditions.
Ideal Market Conditions
- Clear downtrend
- Near strong support levels
- Oversold conditions (RSI below 30)
- Declining selling volume
Poor Conditions
- Sideways markets
- Low-volume assets
- Strong bearish trends without support
Context is everything.
How to Identify a Valid Bullish Harami
Many traders mistake random candles for a Bullish Harami. A valid setup requires all conditions below.
Checklist for Confirmation
✔ Prior downtrend
✔ First candle is clearly bearish
✔ Second candle is smaller
✔ Second candle is fully inside the first candle’s body
✔ Appears near support or demand zone
If even one condition is missing, the pattern loses reliability.
Bullish Harami on Different Timeframes
Short Timeframes (5m – 15m)
- Common but less reliable
- Requires strict confirmation
- Best for scalping with volume confirmation
Medium Timeframes (1H – 4H)
- Balanced reliability
- Good for swing traders
Higher Timeframes (Daily – Weekly)
- Strongest signals
- Fewer setups but higher success rate
- Ideal for positional traders and investors
How to Trade the Bullish Harami (Step-by-Step)
Identify the Downtrend
Never trade a Bullish Harami in isolation. Confirm that the market has been making lower highs and lower lows.
Wait for the Pattern to Form
Ensure the second candle closes fully within the first candle’s body.
Look for Confirmation
This is crucial. Confirmation may include:
- A bullish candle closing above the Harami
- Volume increase
- RSI divergence
- Support zone rejection
Entry Strategy
- Conservative entry: Above the high of the second candle
- Aggressive entry: At candle close with confirmation
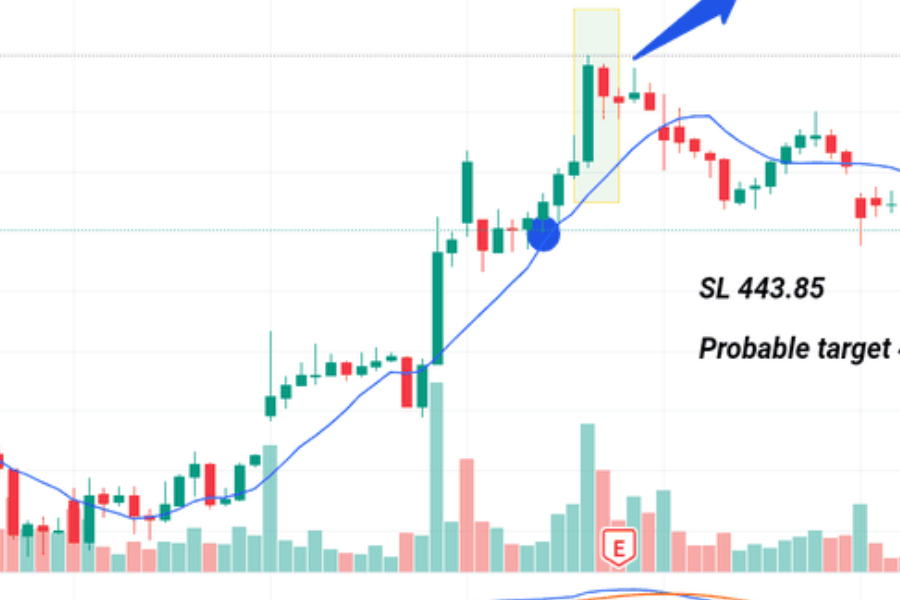
Stop Loss Placement
- Below the low of the first candle
- Or slightly below a key support level
Profit Targets
- Nearest resistance
- Previous swing high
- Risk-to-reward ratio of at least 1:2
Using Indicators with Bullish Harami
The Bullish Harami becomes far more effective when combined with indicators.
RSI (Relative Strength Index)
- RSI below 30 adds strength
- Bullish divergence increases reliability
Moving Averages
- Harami near 50 EMA or 200 EMA support
- Trend change confirmation when price crosses MA
Volume
- Rising volume on the confirmation candle is a strong signal
- Low volume reduces reliability
Bullish Harami in Forex Trading
In Forex markets, the Bullish Harami often appears during:
- Market exhaustion
- Major session transitions
- News-related pullbacks
Currency pairs with high liquidity (EUR/USD, GBP/USD) show more reliable Harami setups compared to exotic pairs.
Bullish Harami in Stock Market Trading
In stocks, the Bullish Harami is especially effective:
- After earnings sell-offs
- Near historical support
- In oversold growth stocks
Institutional buying often begins quietly, which aligns perfectly with the psychology of this pattern.
Bullish Harami in Crypto Trading
Crypto markets are volatile, making confirmation essential.
Best Practices for Crypto
- Use higher timeframes
- Avoid low-volume altcoins
- Combine with on-chain data if possible
- Confirm with trendline breaks
Common Mistakes Traders Make
Trading Without Confirmation
The biggest mistake is entering immediately after the pattern forms.
Ignoring Market Context
A Bullish Harami in a strong bearish trend is often a trap.
Overleveraging
Even strong patterns fail. Risk management matters more than accuracy.
Forcing the Pattern
Not every two-candle structure is a Harami.
Bullish Harami vs Bearish Harami
| Feature | Bullish Harami | Bearish Harami |
| Trend | Downtrend | Uptrend |
| Signal | Reversal upward | Reversal downward |
| Candle 1 | Bearish | Bullish |
| Candle 2 | Bullish | Bearish |
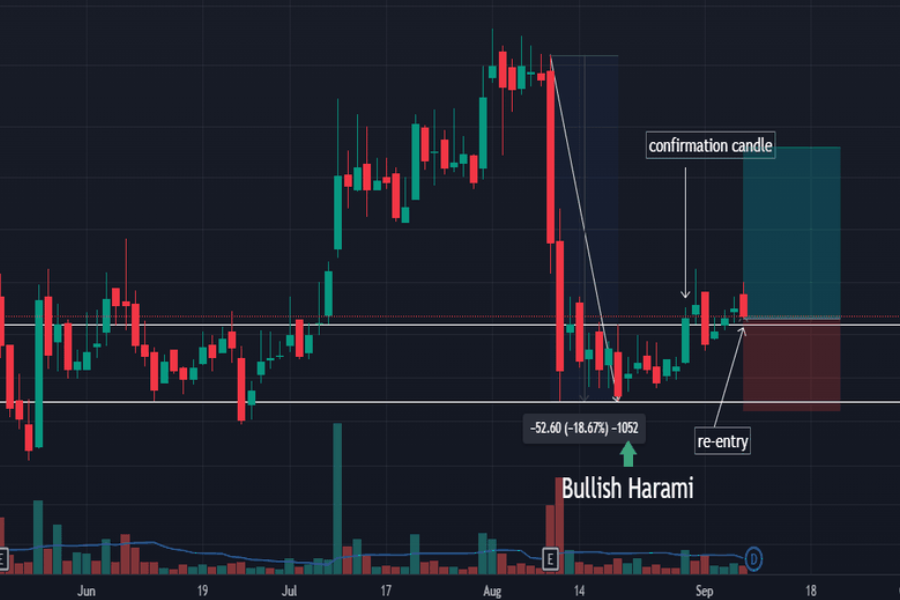
Real-World Example of a Bullish Harami
Imagine a stock falling for weeks due to negative sentiment. It reaches a long-term support level. One day, sellers push the price down aggressively. The next day, the stock opens quietly, trades within the previous day’s range, and closes higher.
Volume increases the following day as buyers step in. The stock begins a multi-week recovery. This is a classic Bullish Harami reversal scenario.
Is the Bullish Harami Reliable?
The Bullish Harami is not a standalone trading system. Its reliability depends on:
- Market structure
- Confirmation
- Risk management
- Trader discipline
When used correctly, it becomes a powerful early-warning signal rather than a guaranteed entry.
FAQs About Bullish Harami
Is Bullish Harami good for beginners?
Yes. It is visually simple and teaches core market psychology concepts.
Can Bullish Harami fail?
Absolutely. No pattern works 100% of the time.
Which timeframe is best?
Daily and 4-hour charts offer the best balance of reliability.
Is Bullish Harami better than Bullish Engulfing?
Not better—just different. Engulfing patterns are stronger but appear less frequently.
Can I use Bullish Harami for long-term investing?
Yes, especially on weekly charts near major support zones.
Key Takeaways
- The Bullish Harami is a two-candle bullish reversal pattern
- It signals weakening selling pressure
- Best used after a downtrend
- Requires confirmation
- Works across stocks, forex, and crypto
- Stronger near support and oversold conditions
- Risk management is essential
Final Thoughts: Should You Use the Bullish Harami?
The Bullish Harami is not a magic signal—but it is a powerful insight into market behavior. It tells you when fear begins to fade and opportunity quietly forms.
Professional traders don’t use it to predict the future. They use it to prepare. When combined with solid analysis, confirmation tools, and disciplined risk control, the Bullish Harami becomes an edge—one that rewards patience and experience.
If you’re serious about trading, mastering patterns like the Bullish Harami is not optional. It’s foundational.


Post Comment